Your Job ID is 1505097678, the file will be deleted in 7 days
You can retrieve it from the main page
Download all tables and plots
Dataset Name: dat_1
Puechmaille Method
Puechmaille, S. J. (2016),The program structure does not reliably recover the correct population structure
when sampling is uneven: subsampling and new estimators alleviate the problem. Molecular Ecology Resources , 16: 608–627.
[link ]
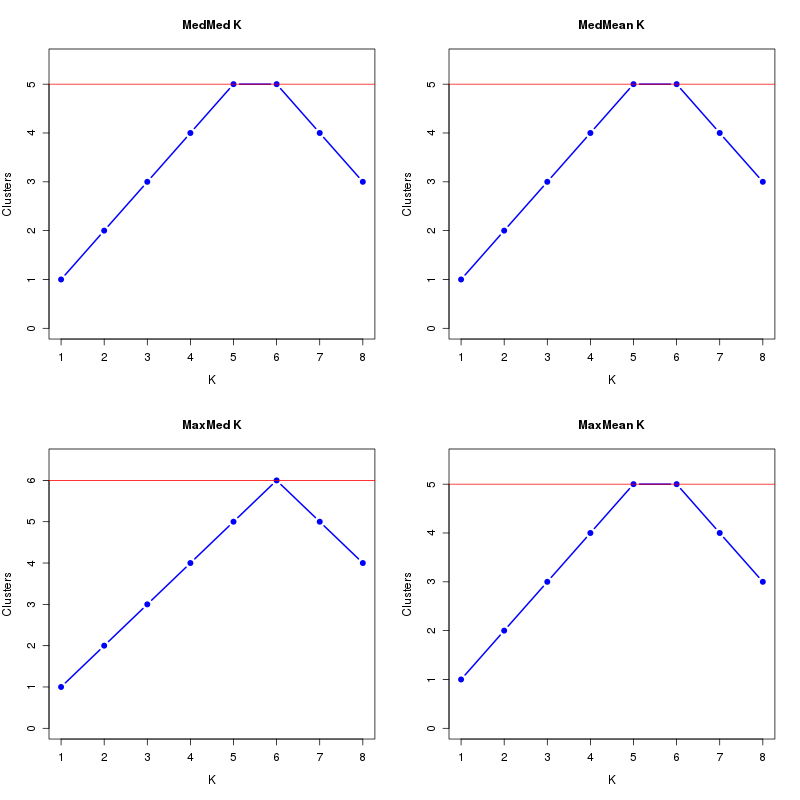
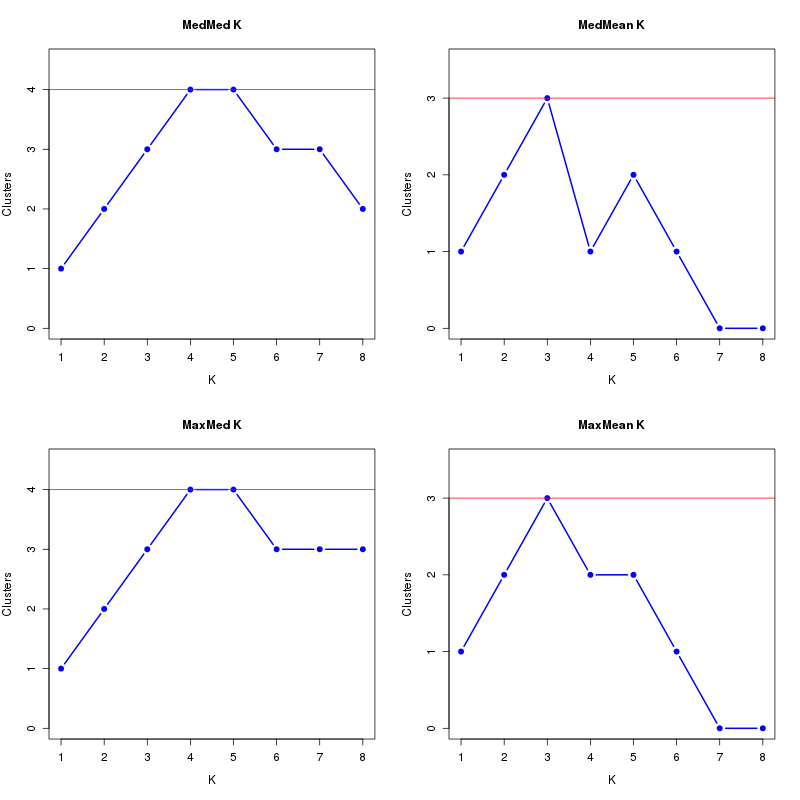
MedMeaK, MaxMeaK, MedMedK, MaxMedK (Threshold=0.5 ):
K MedMed MedMean MaxMed MaxMean Reps
1 1 1 1 1 10 2 2 2 2 2 10 3 3 3 3 3 10 4 4 4 4 4 10 5 5 5 5 5 10 6 5 5 6 5 10 7 4 4 5 4 10 8 3 3 4 3 10 MedMedK MedMeaK MaxMedK MaxMeaK ALL 5 5 6 5
download table dat_1.MedK.0.5.tsv
download plots dat_1.MedK.0.5.pdf
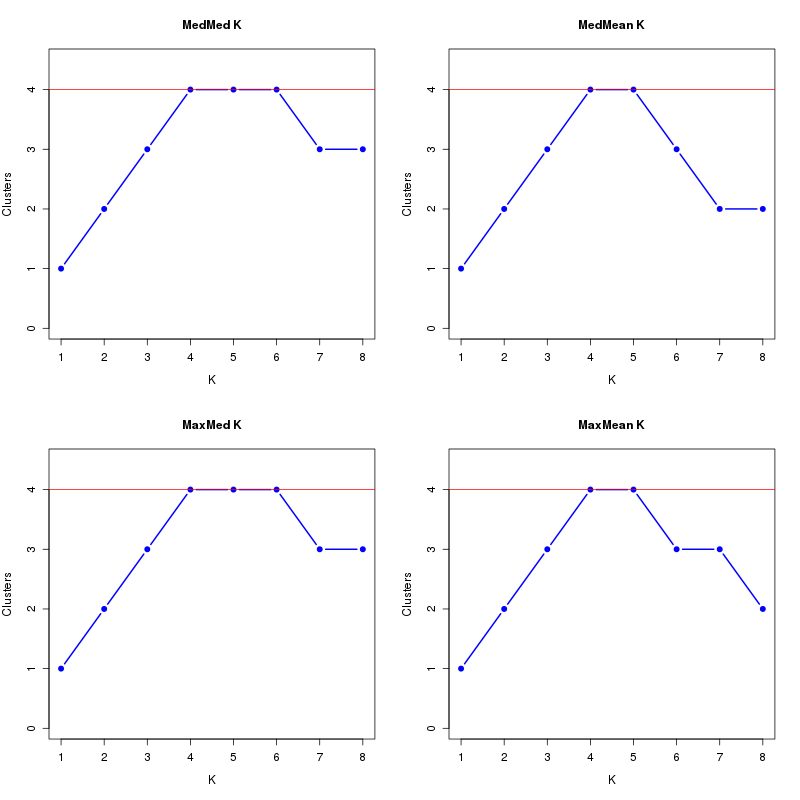
MedMeaK, MaxMeaK, MedMedK, MaxMedK (Threshold=0.6 ):
K MedMed MedMean MaxMed MaxMean Reps
1 1 1 1 1 10 2 2 2 2 2 10 3 3 3 3 3 10 4 4 4 4 4 10 5 4 4 4 4 10 6 4 3 4 3 10 7 3 2 3 3 10 8 3 2 3 2 10 MedMedK MedMeaK MaxMedK MaxMeaK ALL 4 4 4 4
download table dat_1.MedK.0.6.tsv
download plots dat_1.MedK.0.6.pdf
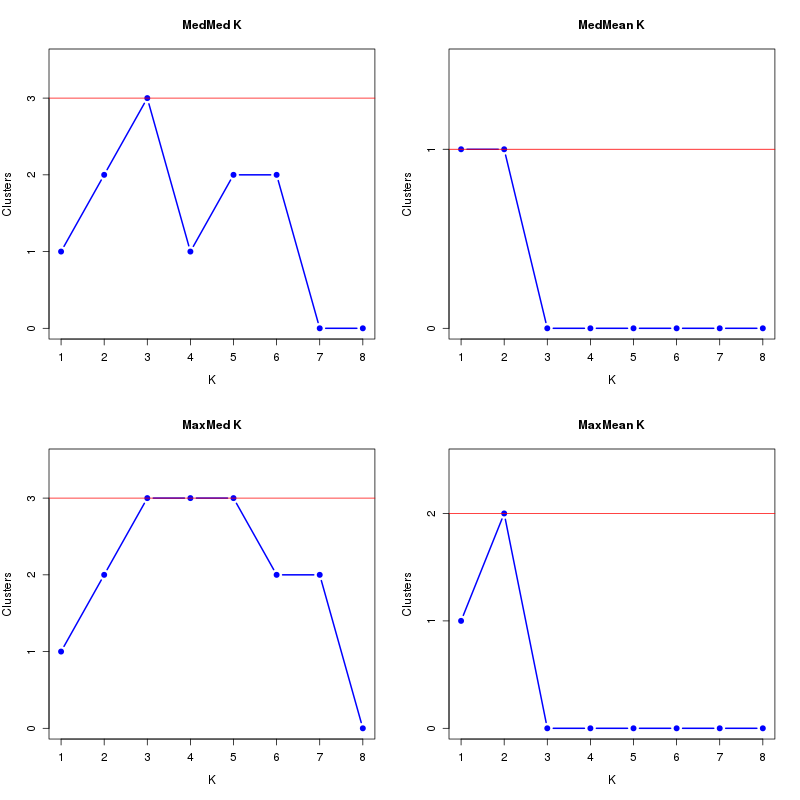
MedMeaK, MaxMeaK, MedMedK, MaxMedK (Threshold=0.7 ):
K MedMed MedMean MaxMed MaxMean Reps
1 1 1 1 1 10 2 2 2 2 2 10 3 3 3 3 3 10 4 4 1 4 2 10 5 4 2 4 2 10 6 3 1 3 1 10 7 3 0 3 0 10 8 2 0 3 0 10 MedMedK MedMeaK MaxMedK MaxMeaK ALL 4 3 4 3
download table dat_1.MedK.0.7.tsv
download plots dat_1.MedK.0.7.pdf
MedMeaK, MaxMeaK, MedMedK, MaxMedK (Threshold=0.8 ):
K MedMed MedMean MaxMed MaxMean Reps
1 1 1 1 1 10 2 2 1 2 2 10 3 3 0 3 0 10 4 1 0 3 0 10 5 2 0 3 0 10 6 2 0 2 0 10 7 0 0 2 0 10 8 0 0 0 0 10 MedMedK MedMeaK MaxMedK MaxMeaK ALL 3 1 3 2
download table dat_1.MedK.0.8.tsv
download plots dat_1.MedK.0.8.pdf
Evanno method
Evanno et al. (2005), Detecting the number of clusters of individuals
using the software structure: a simulation study Molecular Ecology , 14: 2611–2620.
[link ]
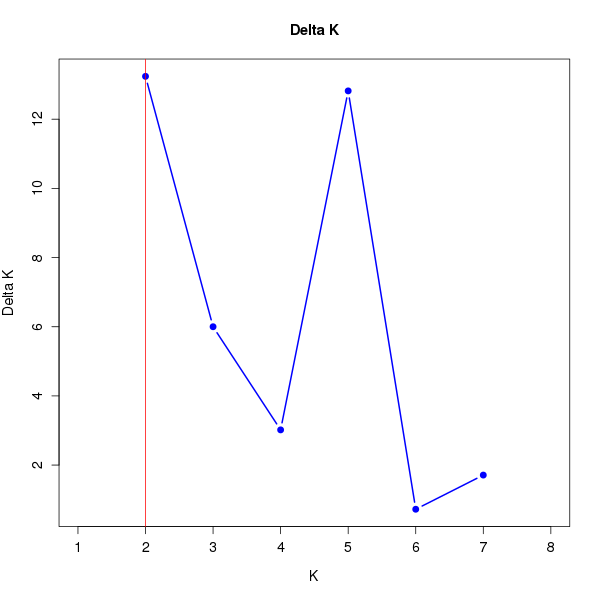
DeltaK:
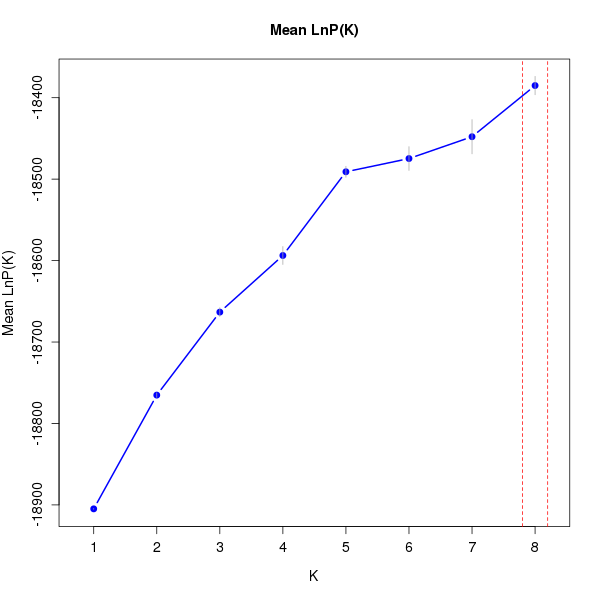
K Reps Mean LnP(K) Stdev LnP(K) Ln'(K) |Ln''(K)| Delta K
1 10 -18904.83000 0.48086 NA NA NA 2 10 -18765.18000 2.85143 139.65000 37.75000 13.23896 3 10 -18663.28000 5.39872 101.90000 32.39000 5.99957 4 10 -18593.77000 11.02503 69.51000 33.27000 3.01768 5 10 -18490.99000 6.75038 102.78000 86.53000 12.81853 6 10 -18474.74000 14.62275 16.25000 10.57000 0.72285 7 10 -18447.92000 21.03309 26.82000 35.98000 1.71064 8 10 -18385.12000 11.29895 62.80000 NA NA
download table dat_1.DeltaK.tsv
download plots dat_1.DeltaK.pdf
download plots dat_1.LnPK.pdf
Choose K Method
Anil Raj, Matthew Stephens, and Jonathan K. Pritchard. (2014),
fastSTRUCTURE: Variational Inference of Population Structure in Large SNP Data Sets,
Genetics , 197:573-589
[link ]
Model components used to explain structure in data is 1
Dataset Name: dat_2
Puechmaille Method
Puechmaille, S. J. (2016),The program structure does not reliably recover the correct population structure
when sampling is uneven: subsampling and new estimators alleviate the problem. Molecular Ecology Resources , 16: 608–627.
[link ]
MedMeaK, MaxMeaK, MedMedK, MaxMedK (Threshold=0.5 ):
K MedMed MedMean MaxMed MaxMean Reps
1 1 1 1 1 10 2 2 2 2 2 10 3 3 3 3 3 10 4 4 4 4 4 10 5 5 5 5 5 10 6 5 5 6 5 10 7 4 4 5 4 10 8 3 3 4 3 10 MedMedK MedMeaK MaxMedK MaxMeaK ALL 5 5 6 5
download table dat_2.MedK.0.5.tsv
download plots dat_2.MedK.0.5.pdf
MedMeaK, MaxMeaK, MedMedK, MaxMedK (Threshold=0.6 ):
K MedMed MedMean MaxMed MaxMean Reps
1 1 1 1 1 10 2 2 2 2 2 10 3 3 3 3 3 10 4 4 4 4 4 10 5 4 4 4 4 10 6 4 3 4 3 10 7 3 2 3 3 10 8 3 2 3 2 10 MedMedK MedMeaK MaxMedK MaxMeaK ALL 4 4 4 4
download table dat_2.MedK.0.6.tsv
download plots dat_2.MedK.0.6.pdf
MedMeaK, MaxMeaK, MedMedK, MaxMedK (Threshold=0.7 ):
K MedMed MedMean MaxMed MaxMean Reps
1 1 1 1 1 10 2 2 2 2 2 10 3 3 3 3 3 10 4 4 1 4 2 10 5 4 2 4 2 10 6 3 1 3 1 10 7 3 0 3 0 10 8 2 0 3 0 10 MedMedK MedMeaK MaxMedK MaxMeaK ALL 4 3 4 3
download table dat_2.MedK.0.7.tsv
download plots dat_2.MedK.0.7.pdf
MedMeaK, MaxMeaK, MedMedK, MaxMedK (Threshold=0.8 ):
K MedMed MedMean MaxMed MaxMean Reps
1 1 1 1 1 10 2 2 1 2 2 10 3 3 0 3 0 10 4 1 0 3 0 10 5 2 0 3 0 10 6 2 0 2 0 10 7 0 0 2 0 10 8 0 0 0 0 10 MedMedK MedMeaK MaxMedK MaxMeaK ALL 3 1 3 2
download table dat_2.MedK.0.8.tsv
download plots dat_2.MedK.0.8.pdf
Evanno method
Evanno et al. (2005), Detecting the number of clusters of individuals
using the software structure: a simulation study Molecular Ecology , 14: 2611–2620.
[link ]
DeltaK:
K Reps Mean LnP(K) Stdev LnP(K) Ln'(K) |Ln''(K)| Delta K
1 10 -18904.83000 0.48086 NA NA NA 2 10 -18765.18000 2.85143 139.65000 37.75000 13.23896 3 10 -18663.28000 5.39872 101.90000 32.39000 5.99957 4 10 -18593.77000 11.02503 69.51000 33.27000 3.01768 5 10 -18490.99000 6.75038 102.78000 86.53000 12.81853 6 10 -18474.74000 14.62275 16.25000 10.57000 0.72285 7 10 -18447.92000 21.03309 26.82000 35.98000 1.71064 8 10 -18385.12000 11.29895 62.80000 NA NA
download table dat_2.DeltaK.tsv
download plots dat_2.DeltaK.pdf
download plots dat_2.LnPK.pdf
Choose K Method
Anil Raj, Matthew Stephens, and Jonathan K. Pritchard. (2014),
fastSTRUCTURE: Variational Inference of Population Structure in Large SNP Data Sets,
Genetics , 197:573-589
[link ]
Model components used to explain structure in data is 1
Dataset Name: dat_3
Puechmaille Method
Puechmaille, S. J. (2016),The program structure does not reliably recover the correct population structure
when sampling is uneven: subsampling and new estimators alleviate the problem. Molecular Ecology Resources , 16: 608–627.
[link ]
MedMeaK, MaxMeaK, MedMedK, MaxMedK (Threshold=0.5 ):
K MedMed MedMean MaxMed MaxMean Reps
1 1 1 1 1 10 2 2 2 2 2 10 3 3 3 3 3 10 4 4 4 4 4 10 5 5 5 5 5 10 6 5 5 6 5 10 7 4 4 5 4 10 8 3 3 4 3 10 MedMedK MedMeaK MaxMedK MaxMeaK ALL 5 5 6 5
download table dat_3.MedK.0.5.tsv
download plots dat_3.MedK.0.5.pdf
MedMeaK, MaxMeaK, MedMedK, MaxMedK (Threshold=0.6 ):
K MedMed MedMean MaxMed MaxMean Reps
1 1 1 1 1 10 2 2 2 2 2 10 3 3 3 3 3 10 4 4 4 4 4 10 5 4 4 4 4 10 6 4 3 4 3 10 7 3 2 3 3 10 8 3 2 3 2 10 MedMedK MedMeaK MaxMedK MaxMeaK ALL 4 4 4 4
download table dat_3.MedK.0.6.tsv
download plots dat_3.MedK.0.6.pdf
MedMeaK, MaxMeaK, MedMedK, MaxMedK (Threshold=0.7 ):
K MedMed MedMean MaxMed MaxMean Reps
1 1 1 1 1 10 2 2 2 2 2 10 3 3 3 3 3 10 4 4 1 4 2 10 5 4 2 4 2 10 6 3 1 3 1 10 7 3 0 3 0 10 8 2 0 3 0 10 MedMedK MedMeaK MaxMedK MaxMeaK ALL 4 3 4 3
download table dat_3.MedK.0.7.tsv
download plots dat_3.MedK.0.7.pdf
MedMeaK, MaxMeaK, MedMedK, MaxMedK (Threshold=0.8 ):
K MedMed MedMean MaxMed MaxMean Reps
1 1 1 1 1 10 2 2 1 2 2 10 3 3 0 3 0 10 4 1 0 3 0 10 5 2 0 3 0 10 6 2 0 2 0 10 7 0 0 2 0 10 8 0 0 0 0 10 MedMedK MedMeaK MaxMedK MaxMeaK ALL 3 1 3 2
download table dat_3.MedK.0.8.tsv
download plots dat_3.MedK.0.8.pdf
Evanno method
Evanno et al. (2005), Detecting the number of clusters of individuals
using the software structure: a simulation study Molecular Ecology , 14: 2611–2620.
[link ]
DeltaK:
K Reps Mean LnP(K) Stdev LnP(K) Ln'(K) |Ln''(K)| Delta K
1 10 -18904.83000 0.48086 NA NA NA 2 10 -18765.18000 2.85143 139.65000 37.75000 13.23896 3 10 -18663.28000 5.39872 101.90000 32.39000 5.99957 4 10 -18593.77000 11.02503 69.51000 33.27000 3.01768 5 10 -18490.99000 6.75038 102.78000 86.53000 12.81853 6 10 -18474.74000 14.62275 16.25000 10.57000 0.72285 7 10 -18447.92000 21.03309 26.82000 35.98000 1.71064 8 10 -18385.12000 11.29895 62.80000 NA NA
download table dat_3.DeltaK.tsv
download plots dat_3.DeltaK.pdf
download plots dat_3.LnPK.pdf
Choose K Method
Anil Raj, Matthew Stephens, and Jonathan K. Pritchard. (2014),
fastSTRUCTURE: Variational Inference of Population Structure in Large SNP Data Sets,
Genetics , 197:573-589
[link ]
Model components used to explain structure in data is 1
Dataset Name: dat_4
Puechmaille Method
Puechmaille, S. J. (2016),The program structure does not reliably recover the correct population structure
when sampling is uneven: subsampling and new estimators alleviate the problem. Molecular Ecology Resources , 16: 608–627.
[link ]
MedMeaK, MaxMeaK, MedMedK, MaxMedK (Threshold=0.5 ):
K MedMed MedMean MaxMed MaxMean Reps
1 1 1 1 1 10 2 2 2 2 2 10 3 3 3 3 3 10 4 4 4 4 4 10 5 5 5 5 5 10 6 5 5 6 5 10 7 4 4 5 4 10 8 3 3 4 3 10 MedMedK MedMeaK MaxMedK MaxMeaK ALL 5 5 6 5
download table dat_4.MedK.0.5.tsv
download plots dat_4.MedK.0.5.pdf
MedMeaK, MaxMeaK, MedMedK, MaxMedK (Threshold=0.6 ):
K MedMed MedMean MaxMed MaxMean Reps
1 1 1 1 1 10 2 2 2 2 2 10 3 3 3 3 3 10 4 4 4 4 4 10 5 4 4 4 4 10 6 4 3 4 3 10 7 3 2 3 3 10 8 3 2 3 2 10 MedMedK MedMeaK MaxMedK MaxMeaK ALL 4 4 4 4
download table dat_4.MedK.0.6.tsv
download plots dat_4.MedK.0.6.pdf
MedMeaK, MaxMeaK, MedMedK, MaxMedK (Threshold=0.7 ):
K MedMed MedMean MaxMed MaxMean Reps
1 1 1 1 1 10 2 2 2 2 2 10 3 3 3 3 3 10 4 4 1 4 2 10 5 4 2 4 2 10 6 3 1 3 1 10 7 3 0 3 0 10 8 2 0 3 0 10 MedMedK MedMeaK MaxMedK MaxMeaK ALL 4 3 4 3
download table dat_4.MedK.0.7.tsv
download plots dat_4.MedK.0.7.pdf
MedMeaK, MaxMeaK, MedMedK, MaxMedK (Threshold=0.8 ):
K MedMed MedMean MaxMed MaxMean Reps
1 1 1 1 1 10 2 2 1 2 2 10 3 3 0 3 0 10 4 1 0 3 0 10 5 2 0 3 0 10 6 2 0 2 0 10 7 0 0 2 0 10 8 0 0 0 0 10 MedMedK MedMeaK MaxMedK MaxMeaK ALL 3 1 3 2
download table dat_4.MedK.0.8.tsv
download plots dat_4.MedK.0.8.pdf
Evanno method
Evanno et al. (2005), Detecting the number of clusters of individuals
using the software structure: a simulation study Molecular Ecology , 14: 2611–2620.
[link ]
DeltaK:
K Reps Mean LnP(K) Stdev LnP(K) Ln'(K) |Ln''(K)| Delta K
1 10 -18904.83000 0.48086 NA NA NA 2 10 -18765.18000 2.85143 139.65000 37.75000 13.23896 3 10 -18663.28000 5.39872 101.90000 32.39000 5.99957 4 10 -18593.77000 11.02503 69.51000 33.27000 3.01768 5 10 -18490.99000 6.75038 102.78000 86.53000 12.81853 6 10 -18474.74000 14.62275 16.25000 10.57000 0.72285 7 10 -18447.92000 21.03309 26.82000 35.98000 1.71064 8 10 -18385.12000 11.29895 62.80000 NA NA
download table dat_4.DeltaK.tsv
download plots dat_4.DeltaK.pdf
download plots dat_4.LnPK.pdf
Choose K Method
Anil Raj, Matthew Stephens, and Jonathan K. Pritchard. (2014),
fastSTRUCTURE: Variational Inference of Population Structure in Large SNP Data Sets,
Genetics , 197:573-589
[link ]
Model components used to explain structure in data is 1
CAS Key Laboratory of Marine Ecology and Environmental Sciences P: (86) 0532-82898894